

Bottleneck Identification for Service Businesses
A growing home services company can have a healthy stream of leads and still lose bookings every afternoon. The phones ring while technicians are on jobs, the office coordinator is updating the CRM, and a caller who reaches voicemail moves on to the next provider. Management may blame advertising, staffing, or seasonality, while the constraint sits in a simple handoff between an incoming call and an available appointment.
Bottleneck identification is the systematic process of finding the single most restrictive point in a workflow, the step with the lowest effective capacity and the greatest effect on overall output. In a service business, that point may be a phone queue, calendar gap, approval chain, CRM task, or person who has become the only route through a critical decision.
The challenge is that service work is distributed and variable. Demand changes by hour, customer needs differ, employees switch between tasks, and work often waits invisibly inside inboxes or software. A useful review of administrative burden in service workflows helps explain why teams can look busy while customer-facing work remains stuck.
Why Service Businesses Lose Revenue to Hidden Constraints
The home services company in the opening scenario might respond by buying more advertising. That can make the situation worse. More leads entering an already overloaded call-handling process create a larger queue, longer response times, and more opportunities for prospects to disappear before anyone qualifies the request.
The first task isn't to ask which employee looks busiest. It's to trace the entire path from customer intent to completed service: call received, lead captured, need understood, appointment offered, technician assigned, confirmation sent, and follow-up recorded. A delay at any one of those points can restrict the output of the whole system.

Why busy teams miss the real problem
Service leaders often optimize visible activity. They add another scheduler because calendars look full, ask salespeople to make more follow-up calls, or pressure technicians to finish jobs faster. Those changes may improve a local metric without increasing completed work across the business.
A receptionist who spends most of the day answering calls may not be the true bottleneck. If the CRM lacks required information, every call can generate rework. If only one manager approves discounts, qualified opportunities can sit idle. If appointment slots aren't released quickly after cancellations, the constraint may be calendar governance rather than staffing.
Practical rule: Follow the customer's work, not the organizational chart. The constraint usually appears where work waits between responsibilities.
A conversion resource such as ViralRef's Square conversion playbook can help teams examine the journey from interest to action, but conversion improvement still depends on finding the operational point that prevents customers from moving forward. Map that point before changing scripts, campaigns, or headcount.
What bottleneck identification changes
Once the constraint is visible, managers can sequence improvements sensibly. They might protect live-call capacity during peak periods, standardize qualification fields, open more usable calendar slots, or remove an unnecessary approval. The right intervention depends on evidence from the workflow, not on whichever department is complaining loudest.
The rest of the process should support that discipline. Start with a map, test suspected constraints against throughput and waiting data, validate the cause with the people doing the work, and measure again after the change. That approach prevents a common failure mode, fixing a symptom while moving the restriction to another part of the customer journey.
How Bottleneck Identification Evolved from Factories to Service Operations
A customer calls, the agent answers, and the calendar shows available time. The booking still fails because a job type requires an approval no one has assigned. That kind of delay explains why bottleneck identification had to move beyond factory floors.
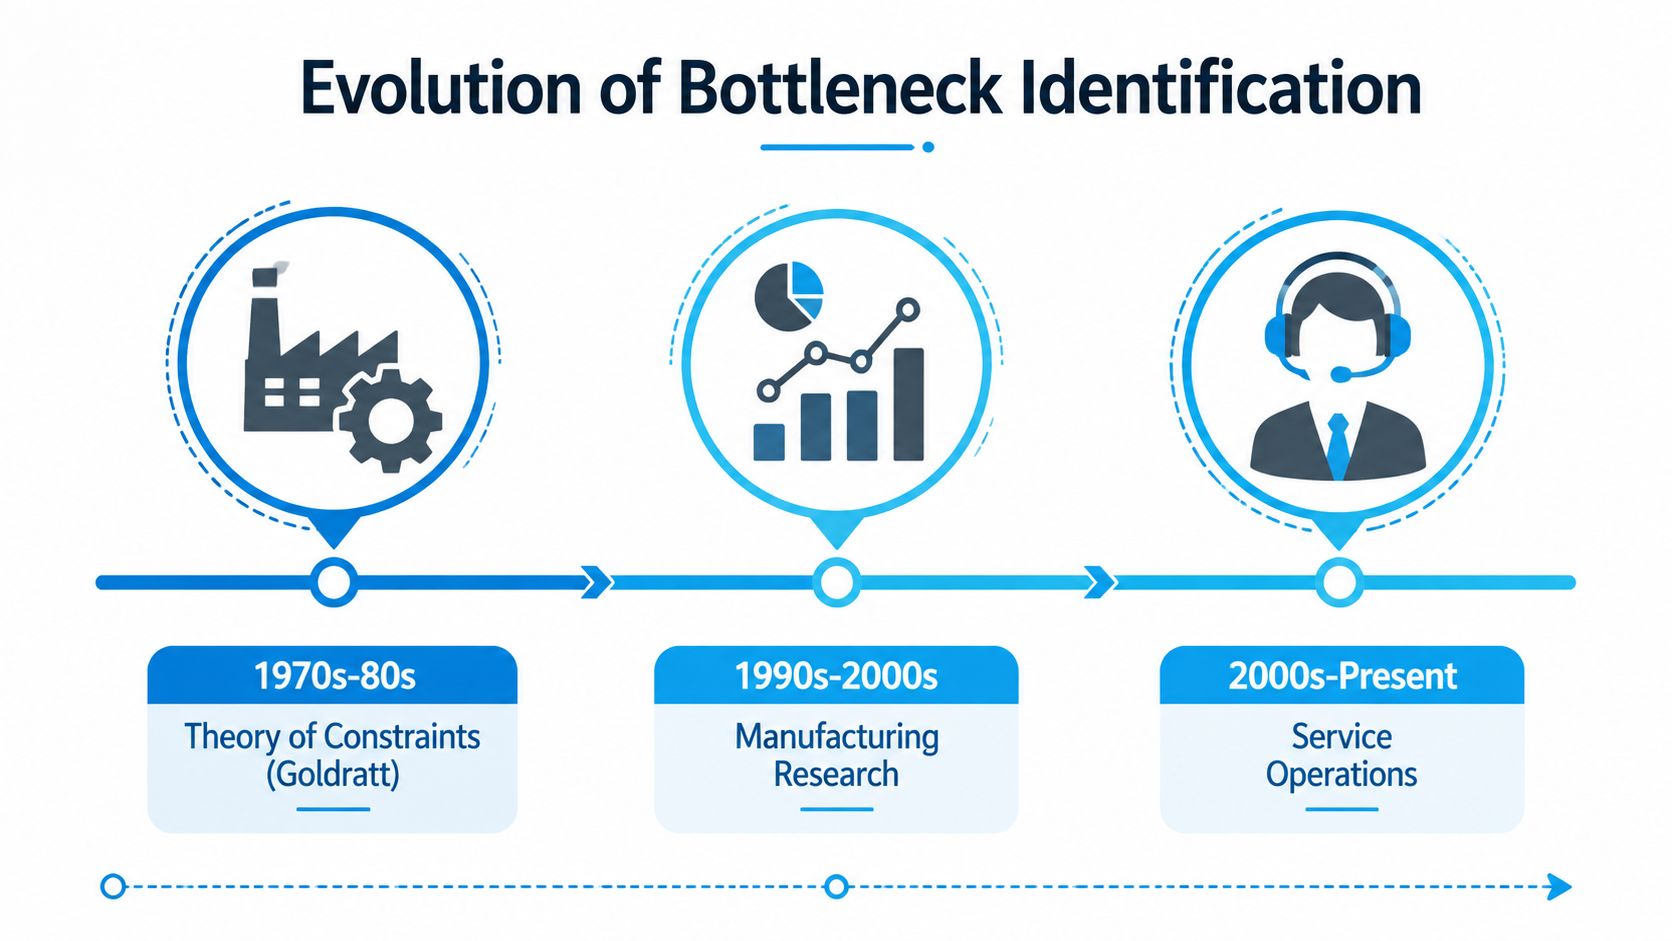
The modern concept grew from Eliyahu M. Goldratt's work on Optimized Production Technology, which began in 1979, and the Theory of Constraints popularized through his 1984 book The Goal (manufacturing research reference). Its core principle is direct: system output is governed by the resource that restricts flow most severely.
That principle changed improvement work. Operations teams stopped treating every slow step as an equal opportunity for optimization and started looking for the constraint that limits total throughput. Making a non-constraint faster can increase local activity, unfinished work, or inventory while leaving system output unchanged.
Why busy teams miss the constraint
A slow machine can retain spare capacity because work reaches it irregularly. A faster machine can sit on the critical path, where a small capacity change affects the entire system. Manufacturing research later formalized this distinction by defining a bottleneck as the machine whose throughput has the greatest sensitivity to total system throughput compared with other machines.
Service workflows have the same relationship, although the resources are distributed. A senior partner may review documents quickly and still restrict a firm when every matter waits for that approval. A call agent may handle conversations efficiently while a calendar rule blocks certain job types. The busiest employee is rarely the limiting factor by default. Waiting, eligibility rules, and handoffs often matter more.
From observation to quantitative diagnosis
Bottleneck analysis has progressed from manual observation toward quantitative methods, especially in manufacturing and process mining. A 2023 systematic review identified 14 detection methods, grouped by their use of queue-state data, process-state data, or both (systematic review of throughput bottleneck detection).
Current analysis examines cycle time, processing time, waiting time, resource utilization, and throughput. Mean and percentile cycle times, waiting-time distributions, control charts, and SPC-style methods can help when a service workflow produces consistent event data.
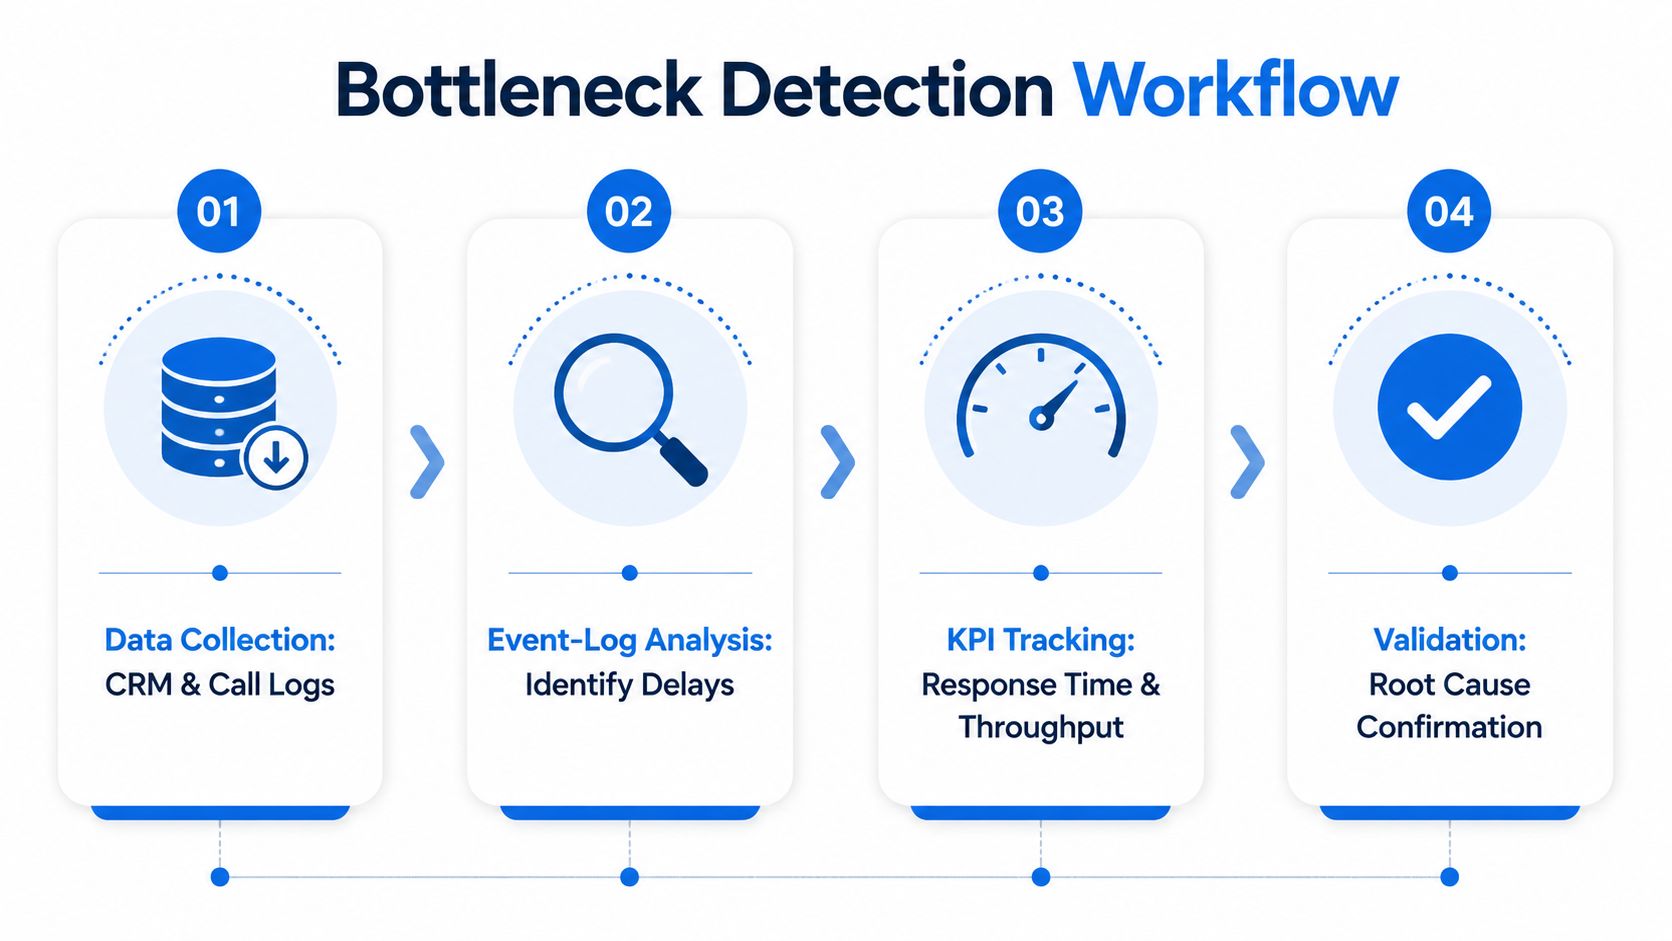
A practical diagnostic workflow combines data collection, event-log construction, process discovery, conformance checking, performance analysis, and improvement recommendations. In a service business, the log may join call timestamps, CRM status changes, calendar actions, approval events, and human handoff records.
The operating challenge is distribution. Factory methods such as queue analysis, gemba walks, simulation, and machine monitoring remain useful, but service teams must apply them across calls, calendars, CRMs, and decisions made between people. That is where a constraint can shift without appearing as a single overloaded machine.
Diagnostic Frameworks for Finding Service Workflow Constraints
No single framework reveals every service bottleneck. A process map shows the route, queue data shows where work accumulates, and root-cause analysis explains why the delay exists. Use them together, but don't collect data indefinitely before acting.
Start with the workflow
Process mapping is the fastest way to expose hidden handoffs. Draw the actual path from lead capture to delivery, including reassignments, callbacks, approvals, exceptions, and manual CRM updates. Ask each role to describe what happens in practice, then compare that version with the documented process.
Value-stream mapping adds a second lens. Mark which activities create customer value and which represent waiting, duplication, correction, or internal coordination. A dental appointment may involve little clinical work but substantial idle time because room turnover, confirmation, and provider availability aren't aligned.
Measure movement and accumulation
Throughput and cycle-time analysis answer different questions. Throughput measures completed work over a defined operating period, while cycle time measures how long an individual item takes to move through the process. Track both by service type, priority, employee, and time of day where possible.
Queue and work-in-progress analysis shows pressure building before output falls. Look for repeated queues in a call system, unassigned CRM records, unsigned legal documents, pending insurance handoffs, or appointment requests without a confirmed slot. A queue that grows during predictable demand windows deserves more attention than a queue caused by an isolated incident.
The five whys is useful after the data identifies a hotspot. If appointments remain unconfirmed, ask why. Perhaps the coordinator lacks access to the calendar, the calendar excludes certain job types, or a manager must approve every exception. Keep asking until the answer points to a changeable process condition rather than a person's supposed lack of urgency. Teams can pair this method with other problem-solving techniques.
| Framework | Best Use Case | Data Required | Complexity |
|---|---|---|---|
| Process mapping | Exposing handoffs and hidden steps | Interviews, observations, workflow records | Low |
| Value-stream mapping | Separating value work from waiting and rework | Activity times, wait times, process notes | Moderate |
| Throughput and cycle-time analysis | Comparing flow across stages or service types | Completion timestamps and stage timestamps | Moderate |
| Queue and WIP analysis | Locating accumulation and capacity mismatch | Queue counts, assignment data, time-of-day records | Moderate |
| Five whys | Finding causes behind a confirmed symptom | Evidence from staff, records, and process rules | Low to moderate |
The best framework depends on the question. Use mapping when nobody agrees on how work flows, queue analysis when the symptom is visible accumulation, and root-cause questioning when metrics show where but not why.
Real-World Bottleneck Examples Across Service Industries
The same symptom can point to very different constraints. A missed appointment, delayed document, or unworked lead is an outcome. Bottleneck identification begins by finding the specific stage that prevented completion.
Home services
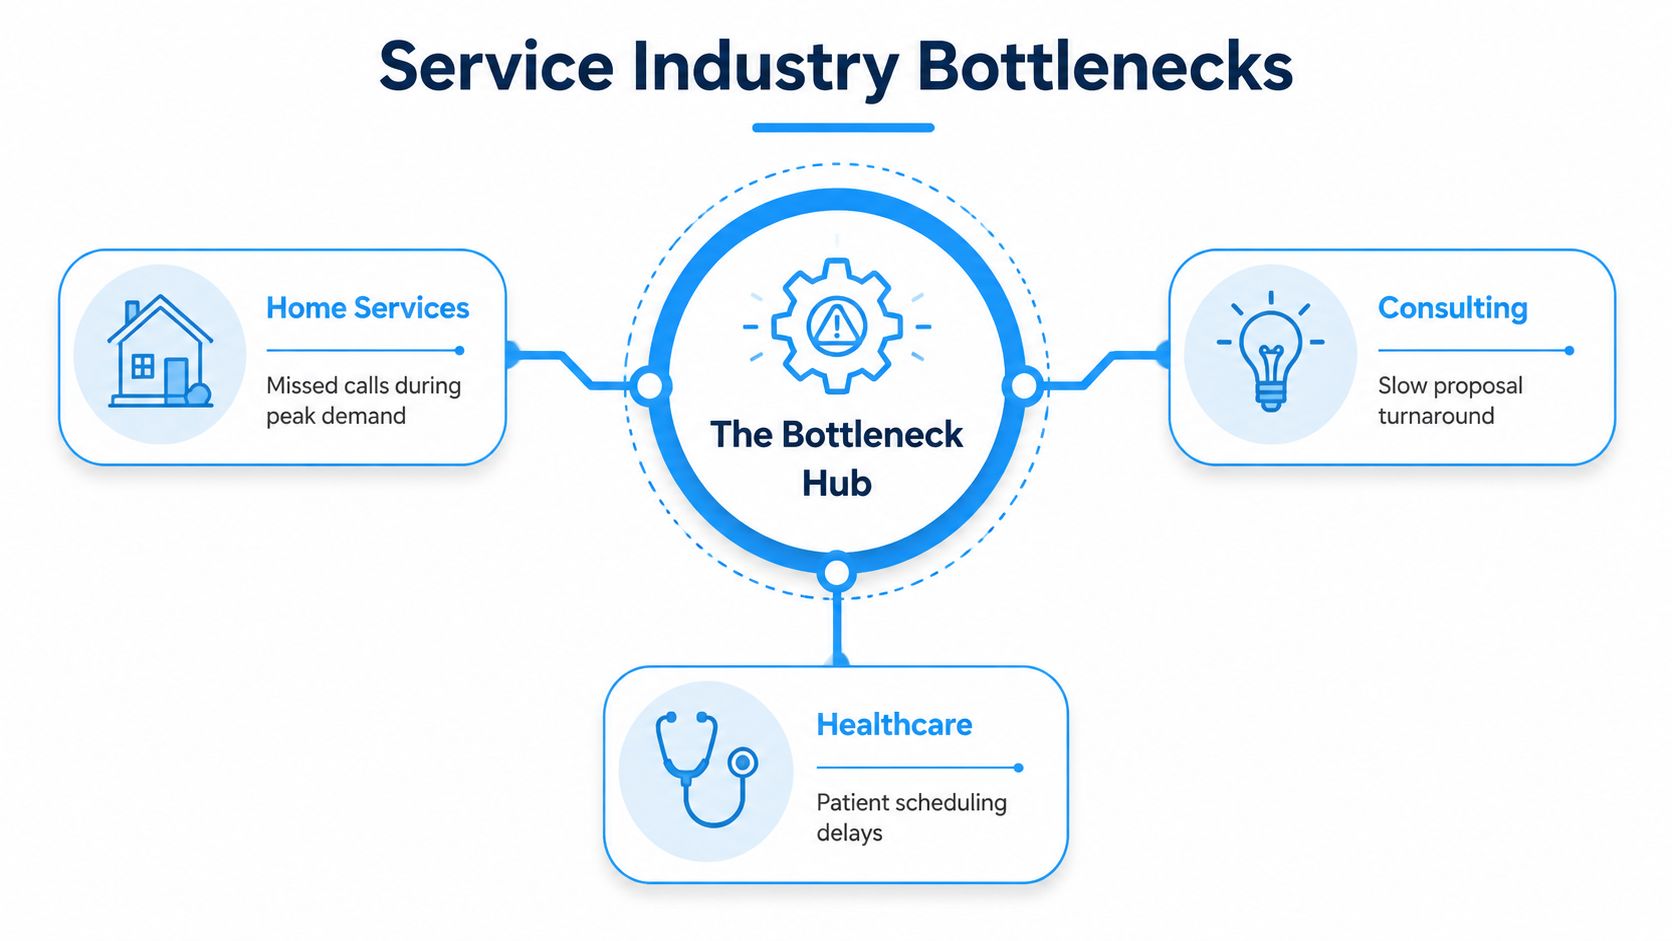
An HVAC company sees missed calls during peak demand. Call-log review shows the constraint isn't lead volume or technician availability. Calls arrive in concentrated bursts while the office team handles active job questions, so the fix is to separate urgent field support from new-lead intake, route overflow calls, and require immediate CRM capture for every new inquiry.
Dental care
A dental clinic has open calendar gaps even though patients are waiting for appointments. Process mapping and scheduling-utilization review reveal that procedure blocks are too rigid, leaving unusable spaces between appointment types. The clinic can create clearer block rules, release unused capacity earlier, and assign a role to fill cancellations from a prepared patient list.
Legal services
A law firm promises quick document turnaround, but drafts wait for partner approval. Cycle-time analysis separates drafting time from approval wait and exposes the approval queue as the constraint. A practical fix is to define approval thresholds, use standardized review checklists, and delegate routine matters while reserving partner attention for complex documents.
Insurance
An agency's claims team appears fully staffed, yet cases remain open. Queue analysis by department shows that adjusters pass incomplete files to a review team, which sends them back for missing information. The agency can establish handoff requirements, reject incomplete transfers at the source, and give one owner responsibility for resolving exceptions.
Franchise operations
A franchise network generates leads centrally, but locations convert them unevenly. Comparing CRM event logs across locations shows inconsistent follow-up ownership rather than a universal sales problem. The network can standardize response tasks, assign local accountability, and monitor unworked leads by location and time period.
A useful fix removes friction from the constrained step. It shouldn't simply make another team process more unfinished work.
The video below provides another visual way to think about process constraints and flow.
Practical Detection Steps and KPIs to Track
Hidden constraints in service operations usually sit across systems. Start with records the business already owns: call logs, CRM timestamps, calendar changes, project-management events, email activity, and approval records. Bring them into a shared view that shows when work entered a stage, when someone acted, and when the next handoff occurred. Perfect data is unnecessary. A dependable timeline is not.
Build the evidence trail
Begin with one valuable workflow, such as inbound lead to booked appointment. Create an event log containing the lead identifier, event type, timestamp, responsible role, service category, and outcome. Process discovery can then compare the sequence employees expect with the sequence recorded across calls, calendars, CRMs, and handoffs.
Track these service KPIs:
- Average call answer time: Separate calls answered immediately from calls handled after a transfer, callback, or escalation.
- Lead-to-appointment conversion rate: Segment results by source, service type, location, and time of day. A strong segment can conceal failure elsewhere.
- Scheduling utilization percentage: Define the denominator consistently, then separate unavailable capacity from capacity that was available but unfilled.
- Average handoff duration: Measure the interval between one team completing its work and the next team accepting responsibility.
- Queue depth by time of day: Plot waiting calls, unassigned leads, pending approvals, and unconfirmed appointments against operating hours.
The useful question is not which metric looks worst. It is which delay limits completed customer work, and whether another team receives more unfinished cases after a change.
Put the signals where managers can use them
A dashboard should place current queues beside historical patterns rather than reducing activity to a monthly average. Show response time, open work, aging items, and throughput together, with filters for location, service line, role, and priority. Teams can use a practical performance dashboard framework to connect operational activity with outcomes.
Set alerts from operating rules, not arbitrary targets. Notify a supervisor when unassigned leads remain open beyond the organization's service promise, when a queue grows through consecutive review intervals, or when approval aging exceeds the normal range for that work type. Review exceptions daily, examine trends weekly, and revisit the workflow after a material process change.
Measurement discipline: A shorter queue is not a win if completed work, customer outcomes, or throughput deteriorate. The fix must improve flow across the service, not make another team process more unfinished work.
Appointment-based operators can also review guidance on how to streamline your gym with Fitness GM, particularly where scheduling, member communication, and staff coordination intersect. The systems vary, but the diagnostic question remains consistent: where does customer work wait?
Distinguishing Real Bottlenecks from Transient Micro-Stoppages
A visible queue does not guarantee a persistent bottleneck. A demand burst, staff break, system outage, or unusual case can create a short-lived stoppage that disappears before a process change is justified.
Service constraints also move between calls, calendars, CRMs, and human handoffs. A call queue may restrict flow during a demand spike, while an approval queue becomes the limiting point later. Staffing, priority rules, cancellations, and urgent cases can shift pressure from one node to another.
Validate persistence over time
Use time-series views instead of relying on a single snapshot. Compare candidate constraints across operating periods, service categories, staffing conditions, and demand patterns. A persistent constraint repeatedly coincides with reduced or delayed output. A transient stoppage appears as an isolated disturbance.
Compare candidates by throughput sensitivity as well. If adding capacity at one stage produces little improvement because another stage immediately limits flow, the first stage is not the dominant constraint. In service operations, this separates a step that looks slow from the resource most capable of changing whole-system output. The bottleneck sensitivity framework formalizes this distinction in manufacturing research, and the same reasoning helps assess distributed service workflows.
Recheck after every intervention
After changing staffing, routing, approval rules, or calendar design, retain the same measurements. Check whether waiting time, queue depth, cycle time, and completed work moved in the intended direction. A queue can shrink while throughput stays flat, which indicates that the intervention moved the symptom rather than relieving the constraint.
High-variance operations need continued review. Record each operating change, compare results with the prior baseline, and watch for the next limiting point to emerge elsewhere.
How AI Receptionist Systems Surface and Resolve Interaction Bottlenecks
A missed call can leave no CRM record. An appointment request may never reach the scheduling queue, while a callback promise disappears when the employee who took the message changes tasks. In service operations, the constraint often sits between systems and people rather than inside one machine.
AI receptionist systems make those handoffs observable by recording interactions and linking communication events with operational actions. Recepta.ai supports inbound and outbound calls, appointment scheduling, lead capture, and follow-ups, with escalation to human agents when a case needs empathy or specialized expertise. Its stated integrations cover 2,500 plus tools, including CRMs, calendars, and industry systems, as described in its AI receptionist resource for small businesses.
The diagnostic value is visibility. Call summaries, real-time analytics, and automatic logging can show caller wait times, escalation points, scheduling failures, and missing follow-up records. Managers can then compare the communication queue with booking capacity, staff availability, and completed work instead of treating the busiest employee's anecdote as the diagnosis.
Use reported product metrics carefully. Recepta.ai's materials cite up to 30 percent more qualified leads, 80 percent cost savings versus in-house reception, and 15 times ROI. Those figures describe reported outcomes under particular operating conditions, not a forecast for every service business. Validate any effect against local call volume, booking completion, staffing cost, escalation rates, and customer experience.
The practical test is simple: measure whether fewer interactions disappear and whether completed service output improves. Recepta.ai combines AI reception, human escalation, scheduling, lead capture, follow-up, and analytics for that measurement, while managers retain responsibility for checking the constraint and adjusting the workflow.