
Average Speed of Answer Explained: Formula and Benchmarks
Average speed of answer (ASA) is the average number of seconds a caller who reaches an agent waited in the queue before being answered. A 2024 UK survey of contact-center leaders put the mean at 116 seconds and the median at 48 seconds, so a tidy average can sit well above the wait many callers get.
You're probably looking at one phone report and wondering if the front desk is fine. A dental office at opening, a plumber after a freeze, or a law firm after a radio spot can all post a calm average while a few callers sit, then hang up. Those hang-ups are booked jobs, appointments, and new matters that never start. The walk-through below shows how the average is built, what it leaves out, and how to set a target for each kind of call you can act on this week.
What Average Speed of Answer Measures
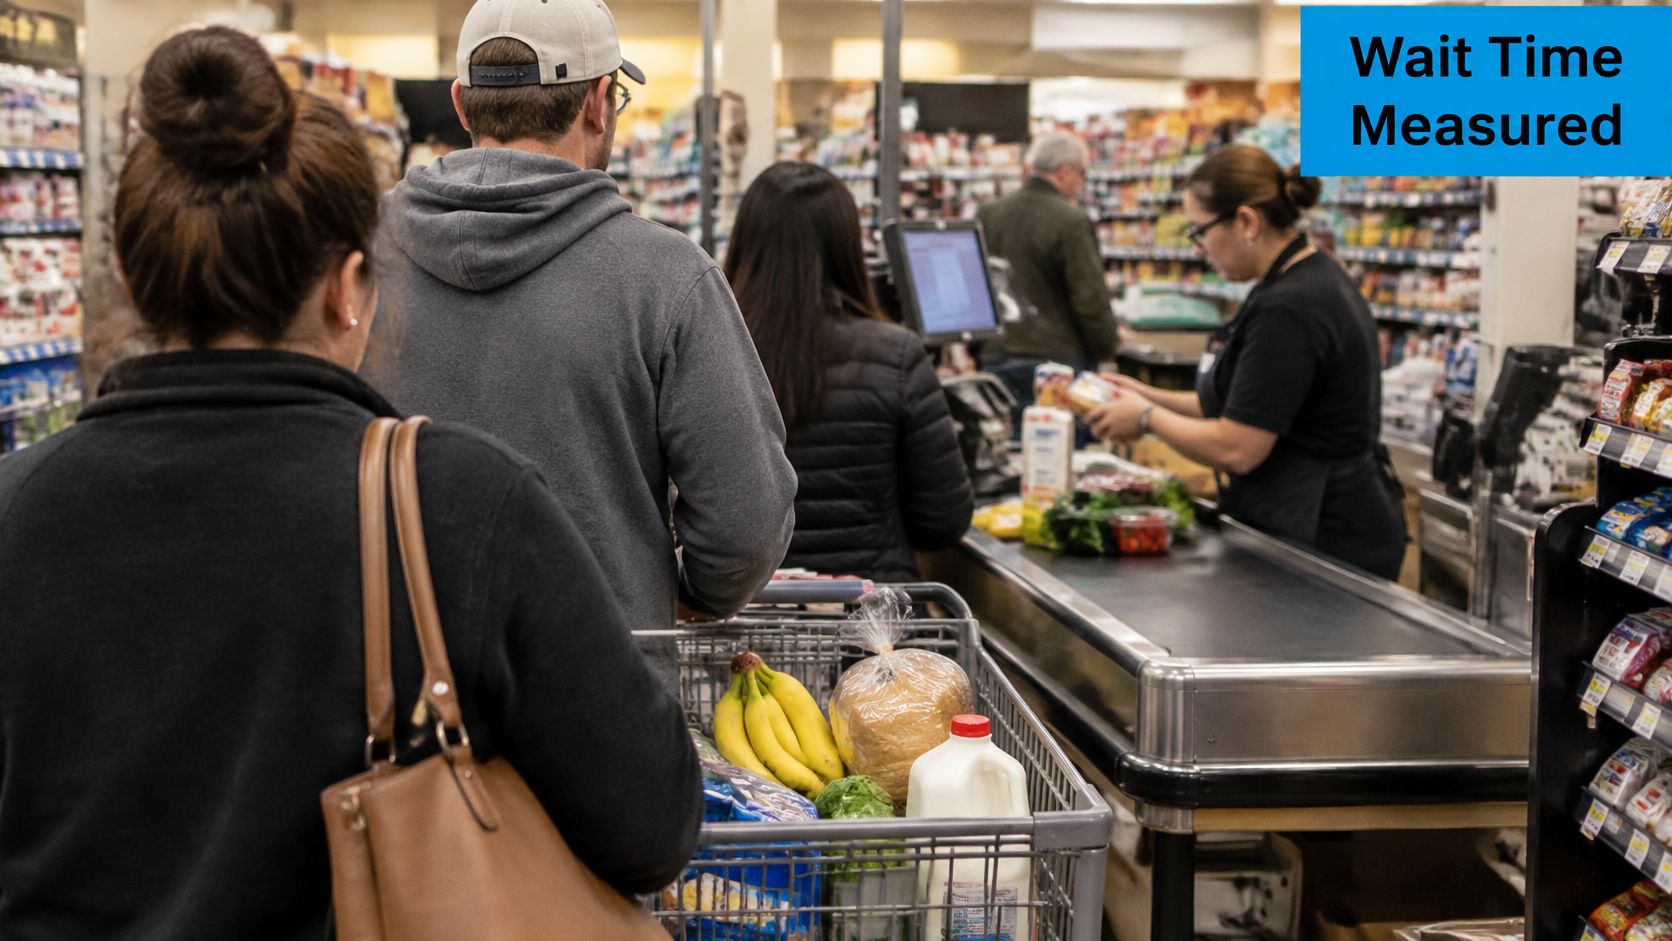
A supermarket checkout line works like a phone queue. Every shopper who reaches a till waited some time first. Average speed of answer applies the same idea to your phones: you average the waits of the people who reached someone. The shopper who left the cart and walked out never enters the math.
Queue time is the core input. Because ASA is a mean, it describes a typical caller only when waits are fairly even. A few very long holds pull the arithmetic average far above what most callers felt. UK contact-center benchmarks often show a mean well above the median for exactly this reason, and the same surveys tend to report abandonment alongside ASA because the two numbers move together.
What sits inside the figure
The standard calculation is total queue-wait seconds for answered calls divided by the number of answered calls. Abandoned calls stay out unless you report them on their own. Menus and ringing may or may not count, so agree the boundary before you compare a vendor, a location, or last month.
Practical rule: Write the definition in your own words, then note whether your report includes abandoned calls. If it doesn't, a low ASA only describes the callers who stayed on the line.
Here is the confusion that trips up most managers: ASA counts the patient callers, not the ones who gave up. For a medical office, a home-service company, or a law firm, a healthy-looking average can sit beside a painful wait for a smaller group at one bad hour. Read ASA next to call volume and the peak hour, and split it by call type (new business, existing clients, vendors) so each group can carry its own target.
How to Calculate Average Speed of Answer
A report that reads "ASA: 30 seconds" tells you almost nothing until you know which calls and which seconds went into it. Two teams can both print 30 seconds and mean different things, because one counted ringing and the other started the clock at the queue.
Five steps a manager can run
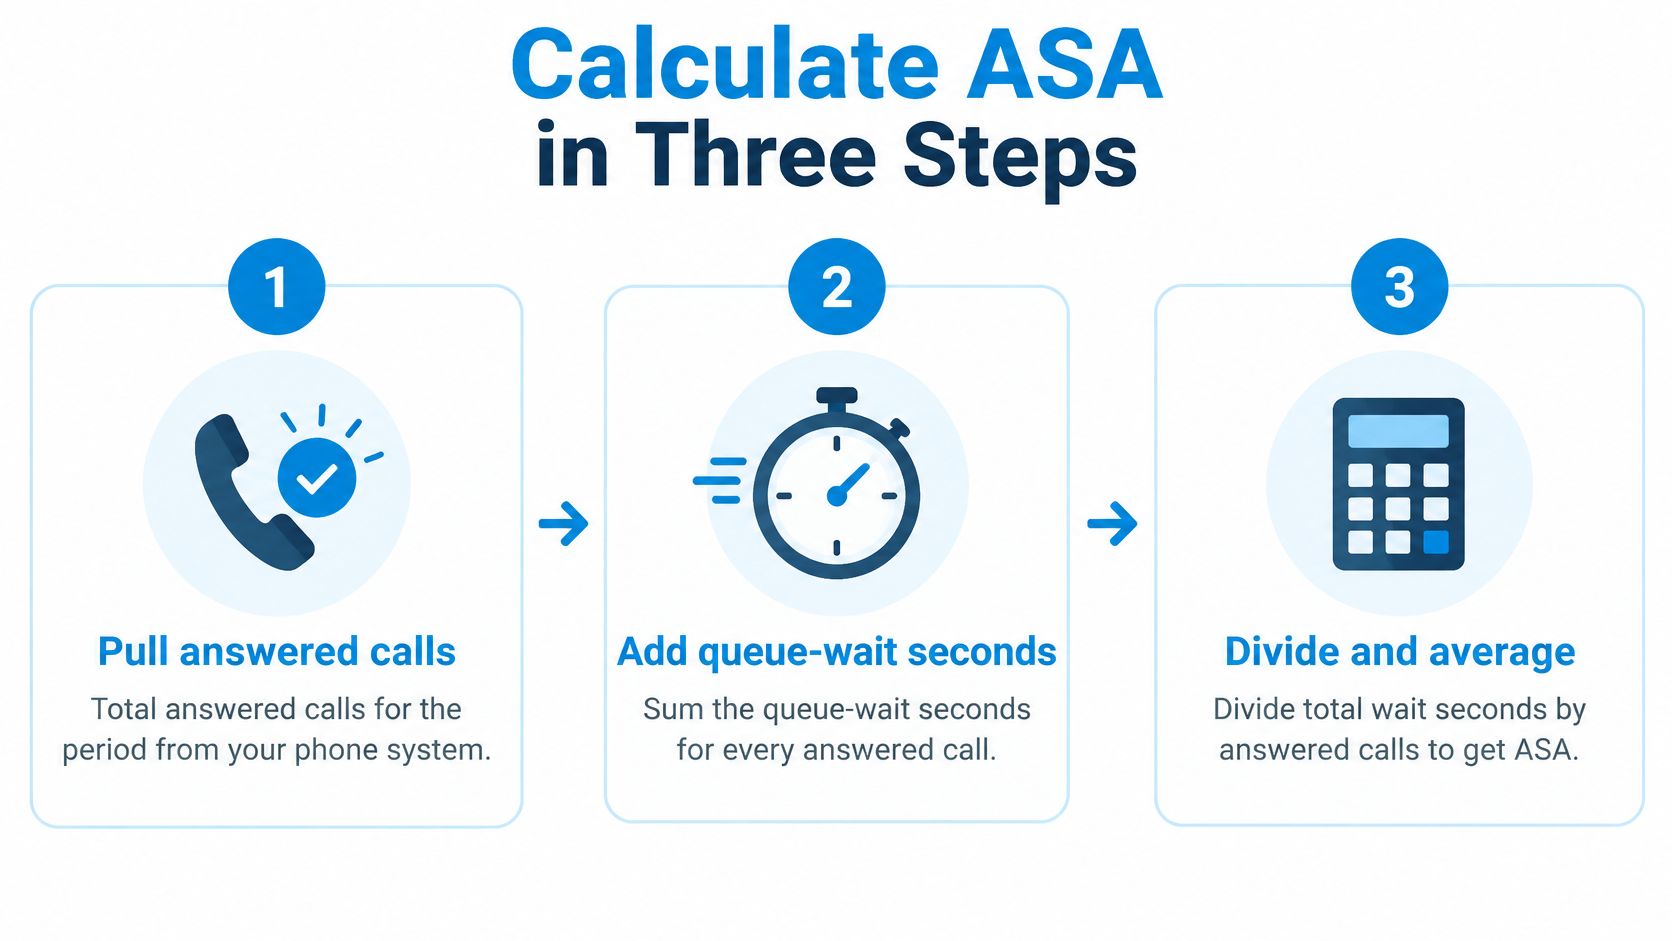
- Pull the answered calls for the period from the phone system. You need a count of connections, not every attempt, because the average is about people who reached an agent.
- Add the queue-wait seconds for every answered call. Cisco's reporting guide defines answer-wait time as total wait divided by answered calls, and that wait can include delay, queue, and ringing. Decide whether IVR time counts, and write the choice down.
- Divide total wait seconds by the number of answered calls. That quotient is the ASA for the period you pulled.
- Round to whole seconds and label the boundary, for example "queue time only, abandoned calls excluded." A naked "30 seconds" can't be compared with another team's 30 seconds.
- Repeat by hour, day, and line. A blended week hides the hour that causes the most problems.
Where the arithmetic goes wrong
Two slips show up constantly. Putting abandoned calls in the denominator makes the average look faster precisely when people gave up, because the callers who waited longest vanish from the count. Averaging daily averages gives a quiet Tuesday the same weight as a storm Monday. Sum the seconds, then divide once.
Run the check on paper: 100 answered calls and 3,000 seconds of qualifying wait produce an ASA of 30 seconds. Use the same division on your own lines.
| Call line | Answered calls | Total queue wait (seconds) | ASA (seconds) |
|---|---|---|---|
| Worked example | 100 | 3,000 | 30 |
| Plumbing dispatch line, storm day | 250 | 4,500 | 18 |
| Law firm intake line | 80 | 6,400 | 80 |
The pooled-versus-averaged trap shows up right in that table. Average the two real lines' ASAs and you get 49 seconds. Pool them correctly, 10,900 wait seconds across 330 answered calls, and the true figure is 33 seconds. The simple average overstated the wait by half because it ignored that the fast line carried most of the volume.
On that storm day the plumbing line looks quick at 18 seconds because a large answered volume met a modest pile of wait. The intake line is slower at 80 seconds even with fewer calls, because each answered caller waited longer. Export one line for last week, run steps 1 through 4, and set that figure next to the same line from the week before.
How ASA Differs From Service Level and Abandonment
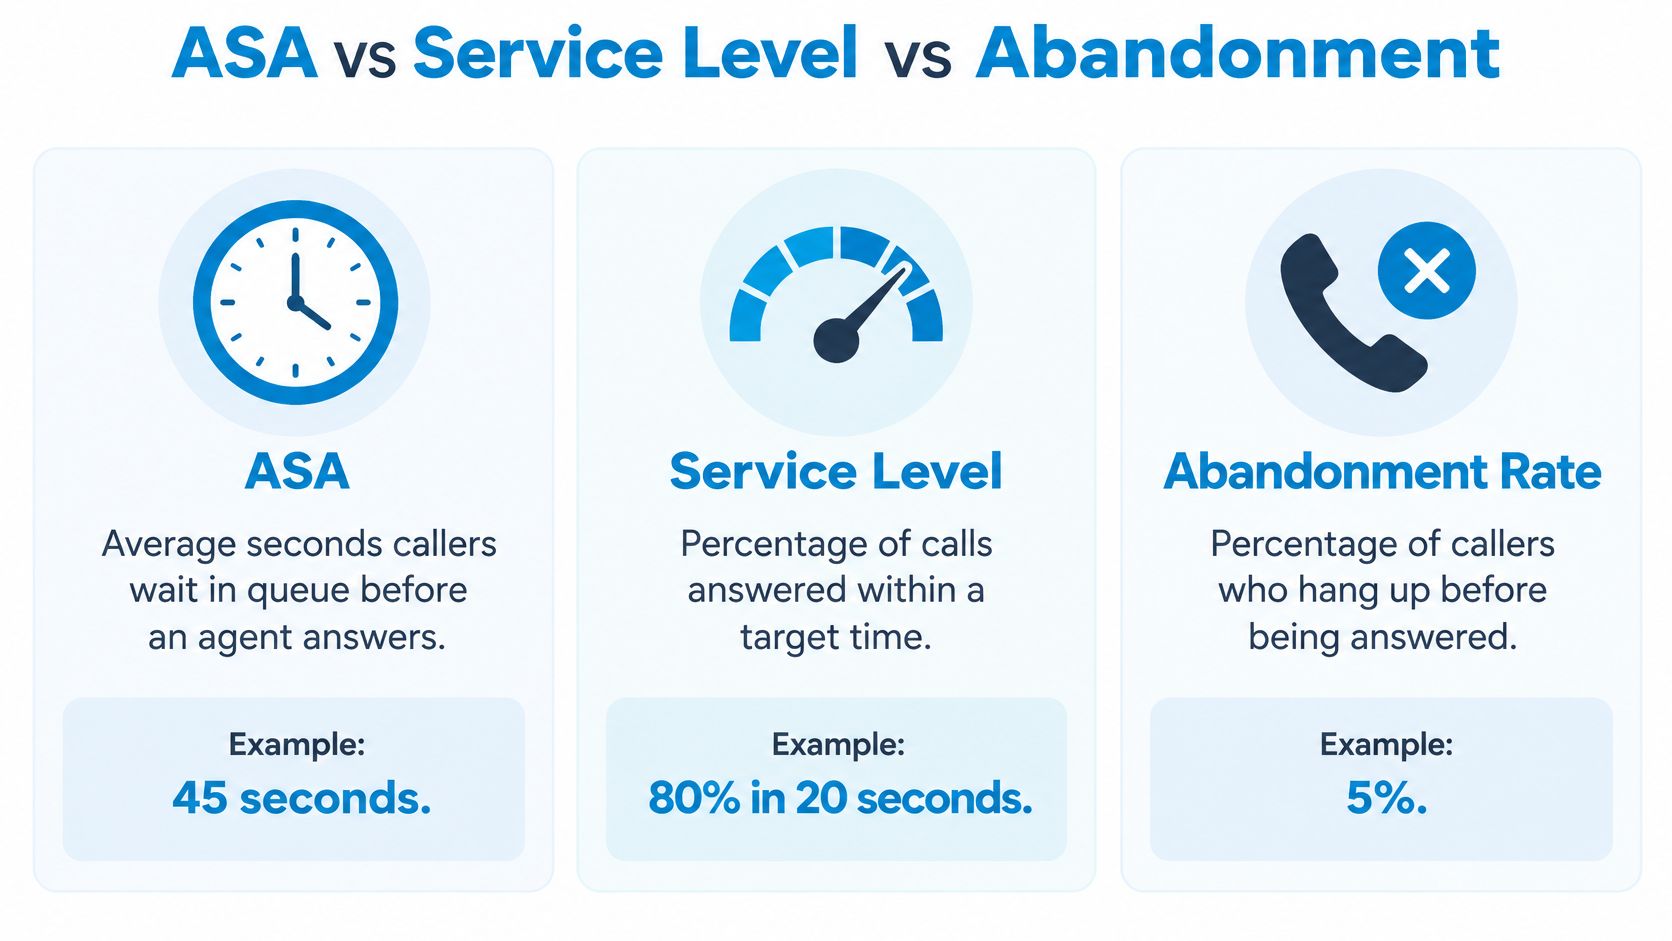
Three numbers get used as if they were the same dial. They answer different questions, and each one hides something the others show.
| Metric | What it measures | Typical form | Example |
|---|---|---|---|
| Average speed of answer | Mean queue wait of answered calls | Seconds | ASA of 28 seconds |
| Service level | Share of calls answered within a threshold | Percentage within seconds | 80% answered within 20 seconds |
| Abandonment rate | Share of callers who hang up before an agent answers | Percentage | 8.4% mean in a 2024 UK survey |
ASA asks how long answered callers waited on average. Service level asks how many calls were answered inside a threshold. Abandonment rate asks how many people gave up before anyone picked up.
A widely used operating target is the “80/20” service level: answer at least 80% of calls within 20 seconds. That is a threshold, not an average. A center can post a 20-second ASA and still miss 80/20 if a smaller group waits much longer. The practical pair is an ASA of 28 seconds shown beside the percentage answered within 20 seconds, plus the abandonment rate.
What each number conceals
ASA hides the spread. Most callers can be quick while a tail waits for minutes, and the mean still looks acceptable. Service level hides the average, so you can clear the threshold and still not know whether the typical wait is 12 seconds or 40. Abandonment hides the reason people left. They may have hit a lunch gap, a bad menu, or a queue that never moved.
Copy this onto one screen: ASA in seconds, percent answered within 20 seconds, and abandonment rate. Read them as a set before you change the schedule.
Map each metric to a decision. ASA and the hourly pattern point to staffing. Service level points to whether the caller experience matches the promise you made. Abandonment points to lost callers. Handle time, covered in average handle time, starts only after the answer, so it explains capacity, not the wait itself.
Why an Average Can Hide Lost Callers
Take ten answered callers. Nine reached an agent after 10 seconds each. One waited 300 seconds. Total wait is 390 seconds, so ASA is 39 seconds. Nine of the ten waited only 10 seconds. That 10 seconds is the median. The average described a wait almost nobody had.
Now add the person the formula never sees. One caller hung up after four minutes. ASA stays at 39 seconds because abandoned calls are excluded. The customer is gone, and the average does not move.
Signals that show the hidden wait
A single ASA can't show that split. These four checks can.
- Longest wait: Sort the day and read the worst holds, not the mean.
- Threshold share: Count how many answered calls cleared your cutoff, such as 20 seconds.
- Hour of day: A calm daily ASA often hides a 7 a.m. or lunch spike.
- Call type: Emergencies, new leads, and routine questions do not share one queue shape.
ICMI's look at what contact centers measure found that 85% report measuring abandonment and 76% report measuring ASA. Plenty of published advice still stops at one number, even when both figures are already on the shelf.
Pushing ASA down by itself can reward the wrong behavior. Agents may end calls early, or the router may grab easy calls first, and the average falls without any proof that callers got better help. The lost caller never enters the math.
Run this test on last week. Pull the longest 5% of waits and the abandoned calls beside them. If the average only looks healthy after you ignore that tail, the number is not a clean bill of health.
Published ASA Benchmarks and What They Really Mean
A national figure is a reference, not a grade for your queue. Match call type, volume, and region before you borrow one, and do not judge a single line by a countrywide mean.
| Benchmark | Reported figure | Setting | How to use it |
|---|---|---|---|
| US average from ContactBabel survey of 207 organizations | 74 seconds | US contact centers | Compare weekly ASA, then segment by call type |
| CCMA 2024 benchmark for UK voice calls | 139 seconds, down from 153 | UK contact centers | Reference point for UK voice queues |
| Australian mystery-shopping research, 2025 | About 109 seconds | Australian contact centers | Shows how measured waits compare with common targets |
| Widely repeated generic target | 20 to 30 seconds | General guidance | Often unrealistic for storms or opening rushes |
| US Social Security national 800-number, FY2018 | Almost 24 minutes | Public-sector capacity constraint | Shows averages follow staffing and demand |
Ender Turing's summary of ContactBabel's survey of 207 US organizations reports a 74-second US average speed of answer, roughly one-third higher than the pre-pandemic average. The CCMA 2024 benchmark found UK voice ASA fell from 153 seconds to 139 seconds. Gladly's metrics roundup notes Australian mystery shopping at about 109 seconds in 2025, far above widely repeated 20 to 30 second targets that buckle in a storm or an opening rush.
A Social Security Administration inspector general review shows the same metric moving with capacity. National 800-number calls averaged roughly 3 to 5 minutes in FY2010 through FY2012, rose above 10 minutes from FY2013, and peaked at almost 24 minutes in FY2018. Fast is not a universal number. It follows demand, staffing, routing, and the period you measure.
A home-services company can set its weekly ASA next to that 74-second reference, then split plumbing emergencies, routine estimates, and appointment calls. Each pattern fills the queue differently. Read any outside promise the same way you read a service level agreement: the number only means something for the work it was written for.
Practical Levers That Shorten Answer Waits
Work from the segment that failed the tail test, and recheck abandonment after every change. A faster average that comes from hang-ups is not an improvement. When the spike is bigger than the current team, Lathire appointment setters are one way to add people who book work instead of leaving callers in a general queue.
- Match staffing to the peak. Pull hourly ASA for four weeks and add coverage only where the average jumps. If a plumbing line sits near 60 seconds from 7 to 9 a.m., one extra person for those two hours is a test you can see by Friday.
- Move simple questions off the live queue. Hours, pricing, and address checks belong in a short menu or an automated answer. Agents keep the calls that need a judgment.
- Offer a callback once the queue crosses a line you choose. Capture the number and call back so the caller doesn't have to gamble on hold. This protects a short surge. It doesn't fix a roster that's short every day.
- Route by call type. Send emergencies to a dedicated group so they skip the general queue. New leads should not wait behind “what are your hours.”
- Cut menu steps you don't need. Time the seconds callers spend in the IVR. If that time counts in your ASA, fewer prompts lower the figure for a real reason.
On high call volumes, check ASA and abandonment the next day, not at month end. If abandonment rises while ASA falls, undo the change.
Set an ASA Target You Can Defend
Set one ASA target per call type, not one number for the whole business. Urgent work, new revenue, and routine questions do not deserve the same wait.
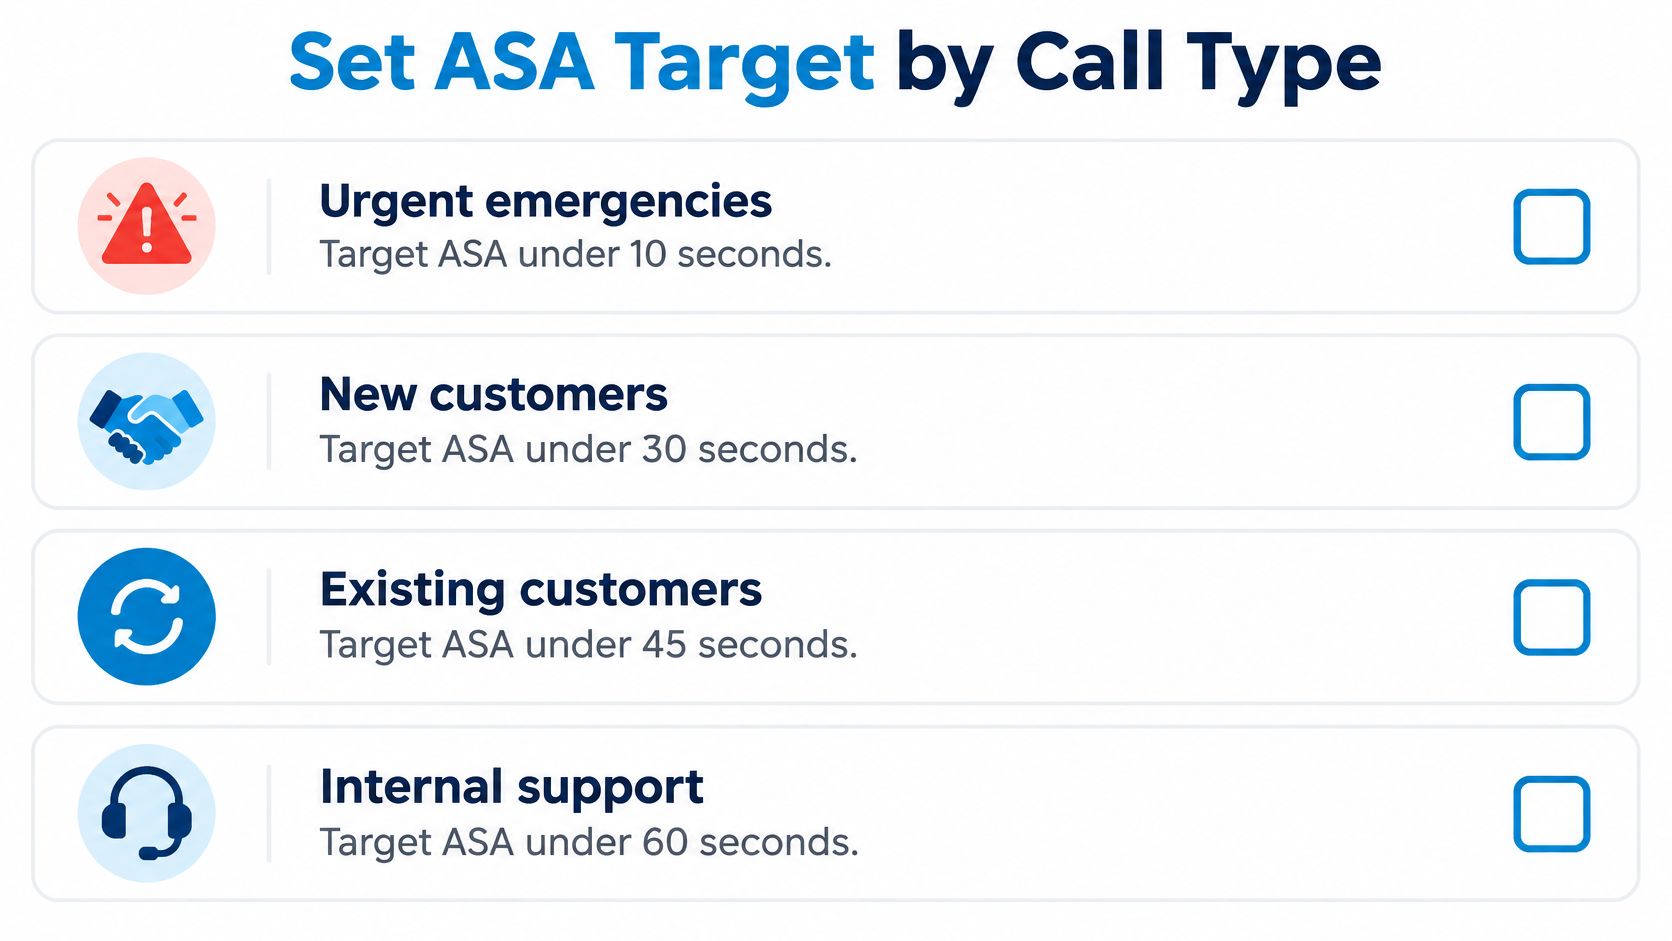
Use the calls you already receive.
- Urgent emergencies: A tight target, for example ASA under 15 seconds with 80% answered within 20 seconds, because delay is the job itself.
- New leads and quotes: Faster than routine traffic. The caller is deciding whether to stay.
- Appointment changes: A moderate wait is fine if the change gets booked.
- Routine questions and after-hours requests: A longer wait is acceptable when the caller can book online or leave a clear request.
Judge time to a useful first response, not only time until a human says hello. A quick acknowledgment that captures the need and books a callback can beat a shorter queue that lands on someone with no context. Calls can be answered within seconds at any hour. The AI handles FAQs, intake, and qualification, and humans handle escalations and edge cases. Most businesses go live in under 15 minutes, so the coverage doesn't have to wait on a long build.
Report ASA beside service level, abandonment, and the longest wait. Track booked jobs or qualified leads by segment, using the same export you already trust for call detail reporting. Hold the targets for four weekly reviews before you loosen or tighten them.
This week, export the last 30 days, calculate ASA per segment with the division you already ran, and mark the segment with the largest gap. That segment gets a target first. Staffing, a callback, or a cleaner route should follow the gap, not a national average.
Recepta.ai answers inbound calls within seconds at any hour, so the wait that ASA is supposed to shrink doesn't depend on who is free at the front desk. AI covers FAQs, intake, and qualification, and people take the escalations, which keeps a fast first response from turning into a lost caller. Visit Recepta.ai and put that coverage on the lines where your longest waits and your abandoned calls already show up.