
Call Center Cost Reduction: A Practical 2026 Playbook
A widely cited Gartner benchmark projects that conversational AI will reduce global contact-center agent labor costs by $80 billion in 2026, according to an industry analysis that also compares routine human interactions costing about $7 to $12 with AI-assisted interactions costing roughly $0.40 each. The benchmark and its cost context point to a bigger truth: call center cost reduction isn't mainly a headcount exercise. It's a waste-removal exercise.
Repeat contacts, incomplete resolutions, poor routing, unnecessary transfers, and handle-time creep inflate the bill long before finance sees a new software invoice. The operation that cuts those leaks can lower cost per contact while protecting service quality. The operation that cuts training, pushes complex calls into automation, or outsources without fixing the workflow usually pays twice.
Where Call Center Costs Actually Go
Start with cost per contact, not the technology roadmap. The standard calculation is total annual contact-center operating expense divided by annual inbound contact volume, as described in this cost-per-contact guidance. If expenses stay flat while resolved contact volume falls, the metric rises, even if the P&L looks unchanged.
Labor is usually the largest controllable expense. Industry analysis places labor at 60% to 70% of total contact-center costs, with some operating models reaching 95%. The cost structure analysis from SupportYourApp supports the same broad conclusion. Labor isn't just hourly pay. Loaded agent cost includes salary, benefits, management, quality assurance, scheduling, workspace, equipment, and software licenses.
Technology and facilities matter, but they rarely move the number as quickly as a broken resolution process. A small increase in average handle time can require more staffed capacity. A repeat contact can consume another agent interaction after the organization already paid for the first one. Those effects compound across every high-volume intent.
| Cost Category | Share of Budget | Example Monthly Spend, 50-seat center | Cost Lever Impact |
|---|---|---|---|
| Labor and management | 60% to 70% in typical models | Largest budget category | High. Reduce avoidable demand, handle time, transfers, and overtime |
| Technology and telephony | Remaining operating spend | Depends on platform and usage | Medium. Consolidate tools and remove unused capacity |
| Facilities and equipment | Remaining operating spend | Depends on site model | Medium. Remote and cloud models can change fixed costs |
| Training and quality assurance | Included in operating overhead | Varies by ramp and oversight model | High when poor training creates repeat contacts or rework |
The precise monthly spend for a 50-seat center depends on wages, geography, occupancy, tooling, and volume. Don't fill that table with a fictional budget. Pull the ledger, then connect each category to one finance-approved line: cost per resolved contact.
The expensive leak is often outside payroll
A call that never needed an agent is waste. So is a call that reaches the wrong queue, requires a transfer, or ends with the customer calling again because the first answer was incomplete. An analysis of hidden contact-center waste identifies these operational failures as major cost drains and notes that a 2025 benchmark put the average inbound call at $7.16 in the United States.
That's why I'd calculate operating expenses before approving a new automation project. Use this operating expense calculation guide to organize the ledger, then reconcile it against contact volume, AHT, repeat contacts, and occupancy.
For routine scheduling, status checks, and basic intake, compare affordable AI receptionist options against the fully loaded cost of assigning those calls to people. The tool isn't the business case. The business case is the avoidable human time it removes without creating a new transfer or repeat call.
Run a Five-Step Cost Diagnostic
Don't start by asking which vendor to buy. Start by asking which intents consume the most paid human time and fail to resolve cleanly.
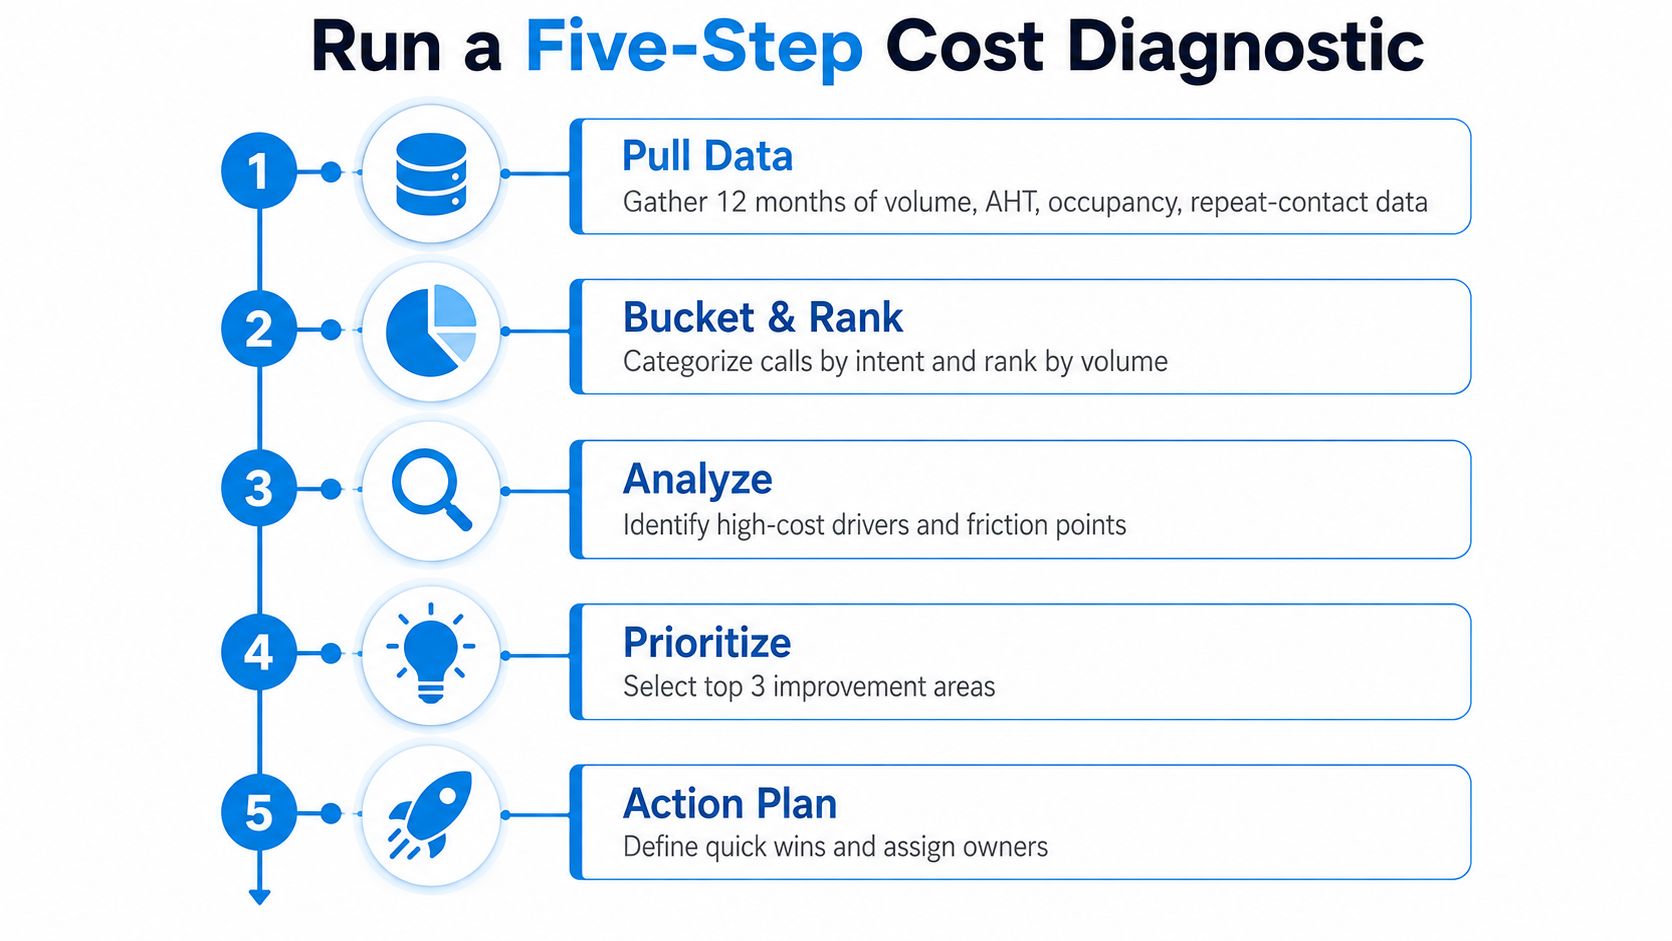
Step one pulls the baseline
Export twelve months of inbound volume, average handle time, occupancy, transfers, and repeat-contact data. Average handle time includes talk time, hold time, and after-call work, so don't measure talk time alone. This AHT guidance shows why the metric belongs in the financial model, including a published example where a 10% AHT reduction lowered cost per call by $0.23, producing about $230,000 in annual savings for a center handling one million calls annually.
The decision is simple: is your primary leak demand, duration, or staffing alignment?
Step two buckets intent
Group calls by what the customer wanted, not merely by the queue that answered. Use categories such as appointment scheduling, order status, account access, billing questions, cancellations, technical troubleshooting, and emergency dispatch.
Rank every intent by volume, AHT, transfer rate, and resolution outcome. The highest-volume intent isn't automatically the best target. A lower-volume intent with long handle time and frequent transfers may consume more labor.
Step three isolates the dominant workload
Identify the top five intents driving 70% of volume, then calculate cost per contact for each intent. Use the same cost allocation method across categories so finance can compare them consistently.
For example, appointment scheduling may have high volume and short AHT, while technical dispatch has lower volume but much longer conversations. The first is a candidate for automation. The second may need better routing, structured intake, or specialist coverage.
Step four exposes repeat work
Add repeat-contact rate by intent. A customer who calls two or three times for one unresolved issue creates cost that a simple volume report hides.
Look for patterns in partial fixes. If agents close a billing inquiry quickly but customers call again after receiving an unclear explanation, lowering AHT has made the metric look better while increasing cost per resolution.
Step five assigns an intervention
Rank drivers by avoidable annual cost and classify each one:
- Automate: Use AI or self-service for deterministic, repetitive requests.
- Redesign: Fix forms, policies, scripts, knowledge articles, or back-office steps that cause repeat contacts.
- Route: Send technical or sensitive interactions directly to the right human skill group.
- Staff: Change headcount only after the first three options have been tested.
Use the bottleneck identification framework to document the constraint, owner, baseline metric, intervention, and finance line. The diagnostic is complete when every major cost driver has a decision attached to it.
Comparing the High-Impact Levers
Four levers consistently deserve attention: automation, selective outsourcing, hybrid overflow staffing, and process redesign. They don't solve the same problem, and treating them as interchangeable is how cost programs fail.
| Lever | Target Cost Band | Typical Payback | Best Fit Condition | Common Failure Mode |
|---|---|---|---|---|
| IVR and AI receptionist | Labor, telecom, after-hours coverage | Fastest when volume is high and resolution is deterministic | Repetitive scheduling, status, intake, and lookup calls | Complex or emotional contacts escalate repeatedly |
| Selective outsourcing | Labor, facilities, training | Fast when demand is variable and work is standardized | Clearly documented, measurable queues | Shallow context, weak quality control, or poor customer fit |
| Hybrid staffing and overflow | Overtime, idle capacity, peak labor | Fast when spikes are predictable | Internal specialists retain complex work | Partner SLAs don't match the customer promise |
| Process redesign | Repeat-contact labor, handle time, rework | Often fastest when the root cause is internal friction | Broken forms, policies, routing, or knowledge | Teams automate symptoms instead of fixing causes |
Automation needs deterministic work
An AI receptionist pays back fastest when the intent is frequent, the required action is clear, and the system can complete the task without a human decision. Appointment booking, basic lead capture, status updates, and after-hours intake fit that pattern.
The economics are compelling. One benchmark pairs human interactions costing about $7 to $12 with AI-assisted interactions around $0.40, implying a 90% to 95% reduction for routine calls. The benchmark source also frames the opportunity around partial containment, not the fantasy that every call should disappear.
Outsourcing changes the cost shape
Outsourcing can convert fixed internal capacity into a variable service cost. It backfires when the partner lacks product context, when customers expect local knowledge, or when the internal team must rework poor notes and escalations.
Use outsourcing for standardized queues first. Keep technical diagnosis, sensitive retention cases, and decisions requiring institutional knowledge with trained internal staff. Outsourced call-center solutions can be evaluated against that boundary, not against a blanket headcount target.
Process fixes often win first
If repeat contacts or transfers dominate the diagnostic, fix the workflow before adding AI. Improve routing, rewrite unclear customer instructions, connect systems, and give agents the information they need inside one workspace.
Choose automation when routine volume dominates. Choose redesign when repeat work dominates. Choose outsourcing when demand fluctuates. Choose hybrid staffing when spikes are the problem and expertise must stay close.
A Realistic Hybrid Rollout
Consider a representative 14-agent regional HVAC service company. Its calls are technical and time-sensitive. Customers need local scheduling knowledge, dispatch decisions, and human judgment when equipment fails outside normal hours.
The company launched a 90-day hybrid model. An AI receptionist handled after-hours and overflow calls, tier-one agents managed intake and triage during business hours, and tier-two specialists handled technical dispatch. The baseline cost per call was $6.80, reaching $4.10 by week 12 after the workflow stabilized.
That result isn't a universal benchmark. It's a rollout model showing where the money moved.
The first weeks exposed the real problem
During the opening weeks, the company connected the AI layer to its scheduling system and paid a one-time integration cost. It also allocated agent training hours to escalation handling, because a successful handoff needs context, not just a transfer.
In week five, call abandonment spiked after the team routed too much overflow into a narrow queue. Managers tightened routing rules, expanded the escalation path, and separated emergency dispatch from routine booking. Abandonment recovered because the team corrected the design instead of blaming demand.
| Week | Inbound Calls | AI-Resolved % | Cost per Call | Abandonment Rate |
|---|---|---|---|---|
| Baseline | Not disclosed | Not applicable | $6.80 | Baseline not disclosed |
| Week 1 | Internal baseline required | Pilot level | Above target during setup | Baseline not disclosed |
| Week 5 | Internal weekly volume required | Pilot level | Volatile during routing change | Spiked before rules were tightened |
| Week 8 | Internal weekly volume required | Stabilizing | Trending below baseline | Recovering |
| Week 12 | Internal weekly volume required | Stable operating level | $4.10 | Controlled operating level |
The table intentionally leaves undisclosed operating fields for the company to populate. Inventing call volume or AI-resolution percentages would make the example less useful, not more credible.
Why hybrid beat pure outsourcing
The AI layer absorbed predictable work. Tier-one agents retained customer context and triage. Tier-two specialists protected technical quality and local dispatch judgment. That division reduced unnecessary human handling without forcing a third-party team to learn every local constraint.
Track the subscription, integration cost, training hours, overtime, and partner charges in the same weekly line. The benefits of AI in customer service matter financially only when the operating model records both the savings and the new costs.
Pitfalls That Quietly Erase the Savings
The most dangerous cost-reduction tactics look excellent in a presentation. They show a lower staffing requirement, a shorter AHT, or a cheaper labor rate. Then contact spikes expose the missing routing rules, weak training, and unresolved customer friction.
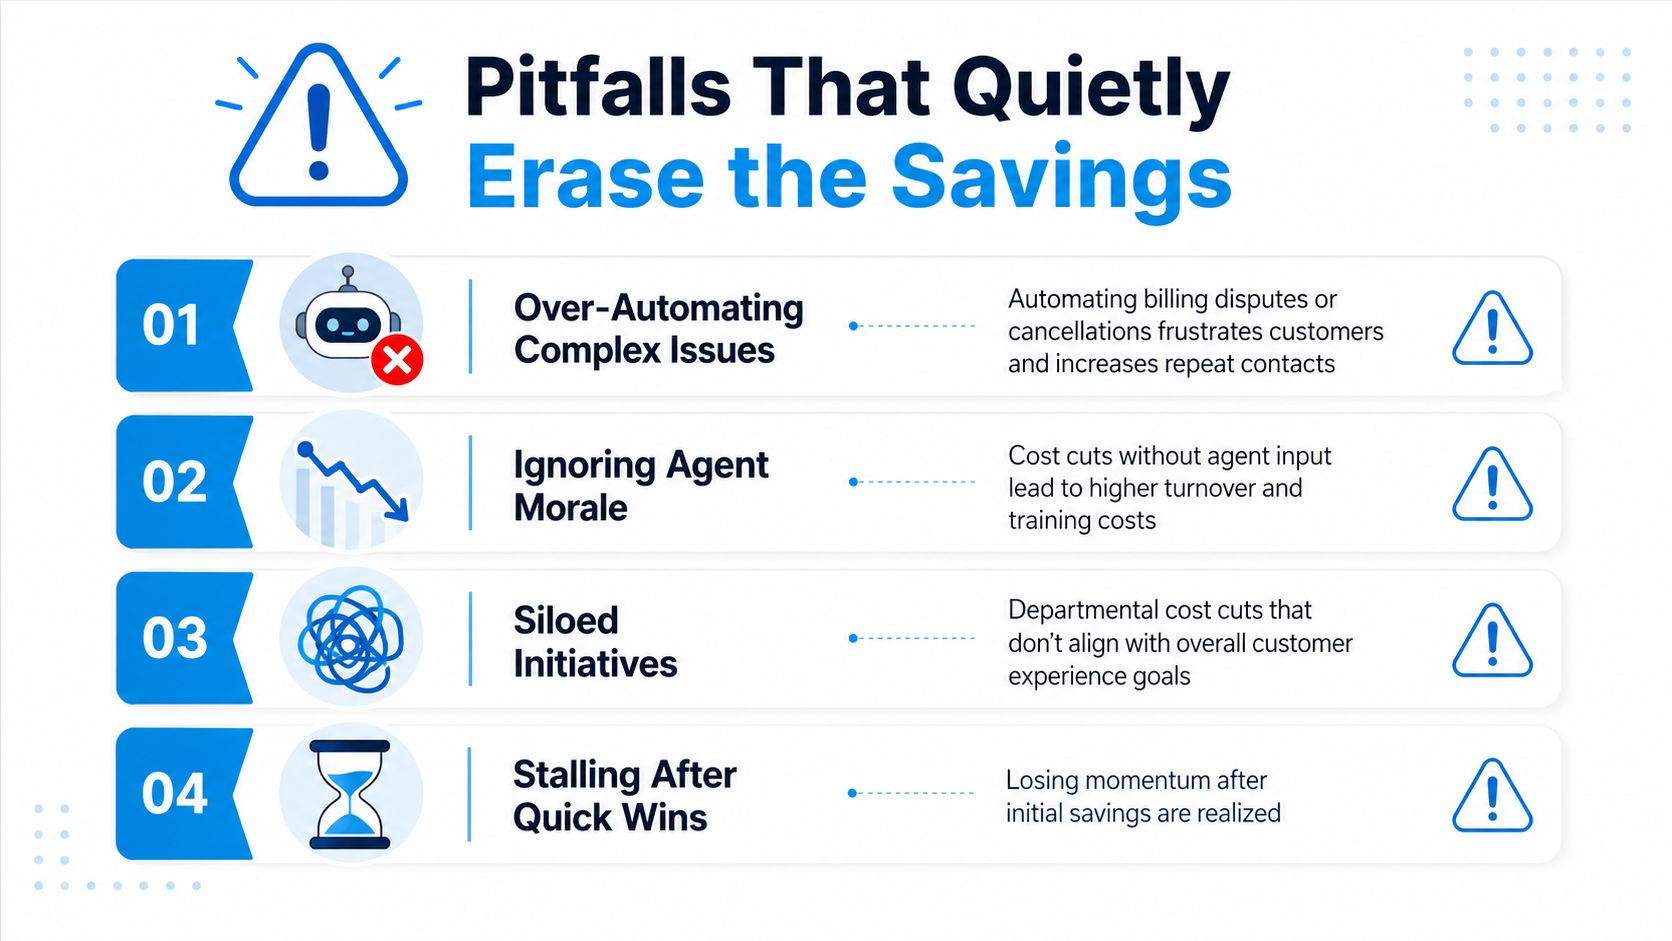
Automating the wrong intent
Billing disputes and cancellation requests look scriptable because they follow recognizable paths. They often contain emotion, exceptions, retention risk, or policy judgment. If the AI can't recognize those signals, escalation rates rise and customers repeat the story to a person.
The stop signal is rising transfer volume paired with repeat contacts. The cheaper alternative is to automate intake and information gathering, then send the complete context to a trained human.
Chasing AHT in isolation
AHT is a useful staffing metric, but agents can lower it by rushing. If customers call again because the root cause wasn't addressed, the operation has shifted cost from one short interaction to multiple interactions.
Watch repeat-contact rate and first-call resolution beside AHT. If AHT falls while repeat contacts rise, stop the initiative and inspect scripts, knowledge articles, and agent incentives.
Practical rule: Never approve an AHT reduction without checking whether the customer stayed resolved.
Outsourcing by default
A lower labor rate isn't the same as a lower cost per resolution. Poor notes, weak quality assurance, repeated escalations, and brand damage can consume the apparent margin.
The warning signs are rework, transfer volume, and customer complaints after outsourced interactions. Use a selective model instead. Outsource standardized work with clear acceptance criteria, and keep sensitive or technical cases with the team that owns the outcome.
Cutting training to fund automation
Training is often the first budget cut because it doesn't look like production capacity. That decision creates longer calls, more errors, weaker first-call resolution, and higher turnover.
A 2025 study reported that 98% of contact centers were using AI, while 61% said conversations had become more difficult. Calabrio's published research announcement makes the operational warning clear. Another cited 2025 report found that 64% of companies using agent assist saw a 28% reduction in average handle time, while 42% saw a 29% drop in attrition. The same coverage links gains to workflow design and retention, not adoption alone.
Your 30-60-90 Day Cost Reduction Plan
A cost program needs a clock, an owner, and a kill rule. Without those, the first automation win becomes a slide in a quarterly review while the old waste returns through repeat contacts and manual work.
Days 1 to 30 diagnose and benchmark
Assign one operations owner. Pull the diagnostic data, calculate current cost per contact, measure AHT, repeat-contact rate, occupancy, service level, and first-call resolution, then select the three highest-cost intents.
The progression gate is a clean baseline and a ranked intent list. Kill the project if the data can't connect contacts to intent or if finance can't reconcile the cost-per-contact calculation to the ledger. Fix instrumentation before purchasing a tool.
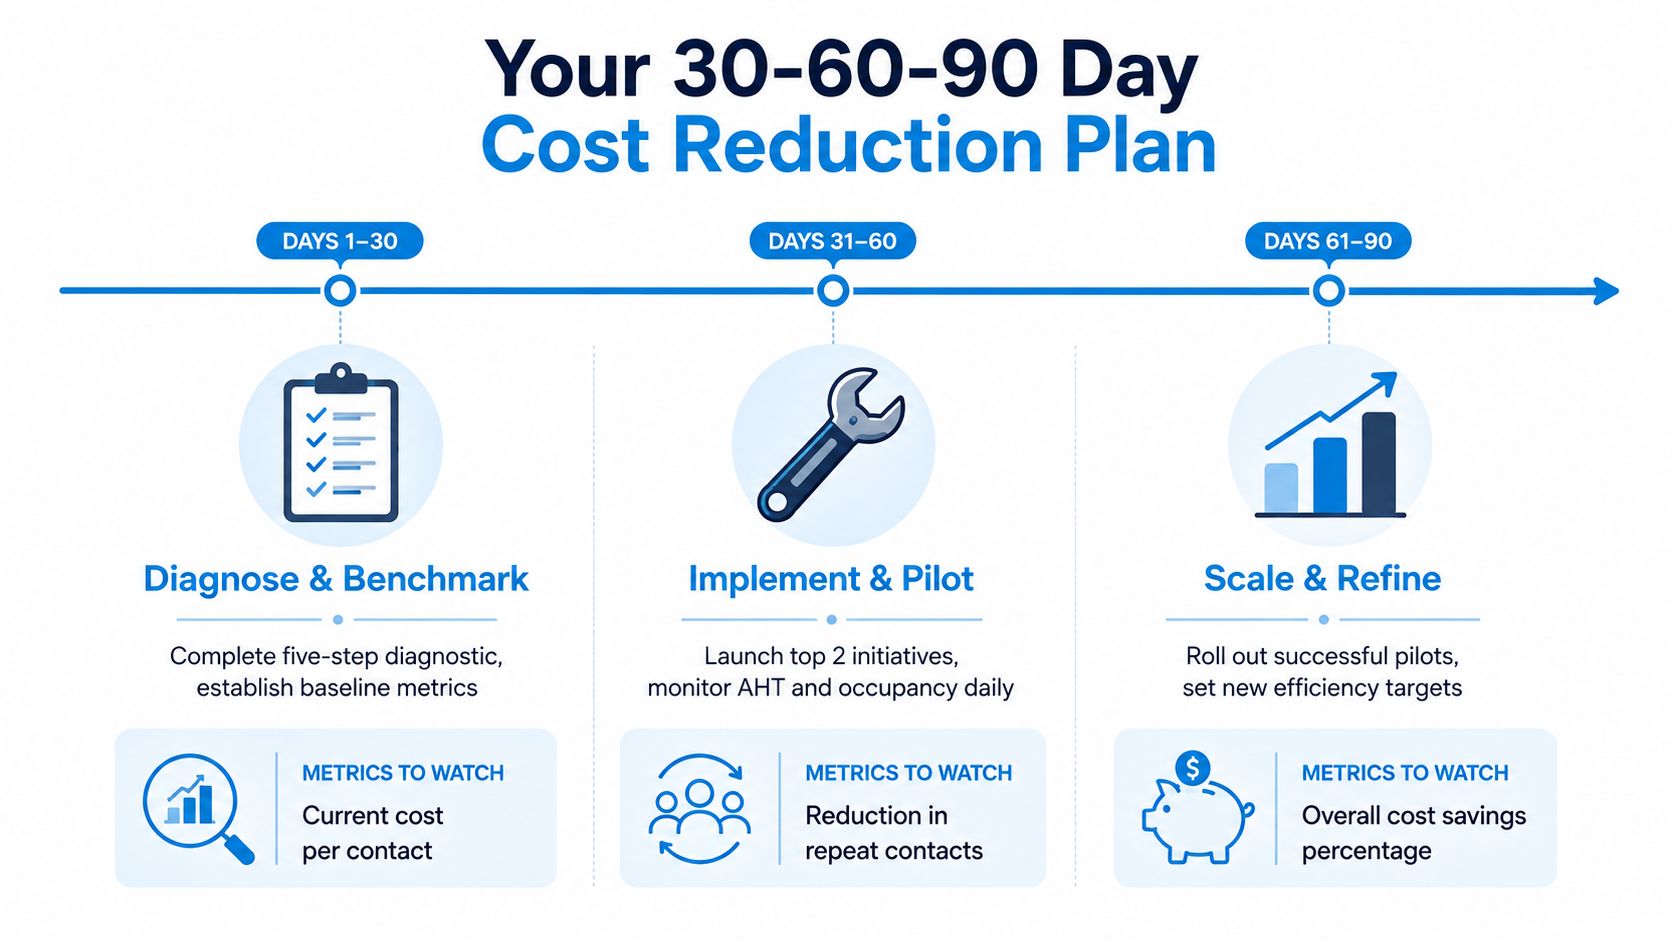
Days 31 to 60 implement and pilot
Assign an owner to each selected intent. Deploy one automation or process change against each, then run a controlled pilot with a shrinking share of traffic. Track deflection, first-call resolution, repeat contacts, AHT, service level, abandonment, and CSAT.
The two progression gates are lower repeat contacts and stable service quality. Kill or redesign a pilot if deflection rises while repeat contacts, transfers, or abandonment worsen. A cheap interaction that creates another interaction isn't a saving.
Service level is the percentage of calls answered within a predefined threshold, such as 20 seconds, and it excludes greetings and IVR time. Talkdesk's contact-center metric guidance explains why the threshold must remain stable while you compare operating periods.
Days 61 to 90 scale and refine
Scale only the pilots that hit the agreed ROI line. Retire the ones that didn't. Renegotiate BPO contracts against the new volume and document the finance view as baseline cost, intervention cost, avoided labor time, repeat-contact change, payback period, and customer-quality guardrails.
Assign finance ownership for the final before-and-after. The progression gates are verified savings and preserved service outcomes. Kill criteria include unresolved data gaps, rising repeat contacts, or savings that exist only because work moved into an unpriced queue.
Use this one-page tracker:
- Intent: Name the customer request and owning team.
- Baseline: Record volume, AHT, repeat contacts, cost per contact, FCR, CSAT, service level, and abandonment.
- Intervention: State the automation, routing, or process change.
- Owner: Name one accountable operator.
- Pilot window: Record the start and end dates.
- Finance line: List labor, technology, training, integration, and partner costs.
- Progression gates: Define the two metrics that must improve.
- Kill criteria: Define the result that forces a pivot.
- Decision: Scale, redesign, or retire.
- Payback: Show the finance-approved calculation.
Call center cost reduction works when every initiative ends in one defensible line: lower cost per resolved contact without hidden rework. Recepta.ai provides an AI receptionist that handles inbound and outbound calls, appointment scheduling, lead capture, follow-ups, and human escalation, so teams can test routine-call automation without removing expert support from complex cases. Visit Recepta.ai to evaluate whether that model fits your highest-volume, most deterministic intents.